User's Guide: ForestPMPlot
Important Package Dependency :
R : library(plotrix)
python : numpy
Usage:
usage: python pmplot.py [meta_input] [meta_output] [study_name] [study_order] [rsid] [gene_name] [out_file]
    [meta_input]                   Input file of METASOFT.
    [meta_output]                  Output file of METASOFT.
    [study_name]                   File containing studynames. One study name per line. The order of the
                                   study names should be matched with [meta_input] and [meta_output] files.
    [study_order]                  File containing the display index of studies. One index per line.
    [rsid]                         Rsid of a SNP to generate ForestPMPlot.
    [gene_name]                    Implicated gene name for the SNP.
    [out_file]                     ForestPMPlot file. (Format : pdf)
Interpretation
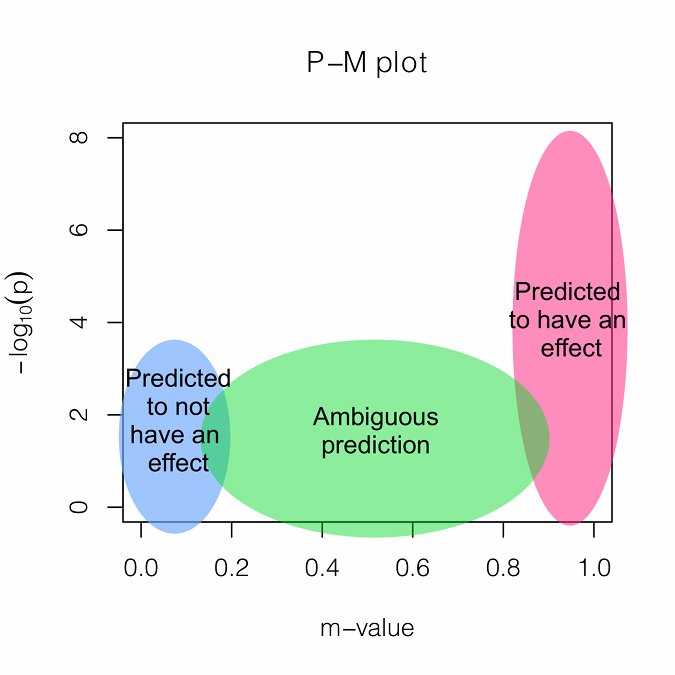
If an associated SNP shows high heterogeneity, interpreting the results is challenging. We provide a measure called M-value, the posterior probability that the effect exists in each study. M-values have the following interpretations.
Small m-value (e.g. < 0.1): The study is predicted to not have an effect.
Large m-value (e.g. > 0.9): The study is predicted to have an effect.
Otherwise: It is ambiguous to make a prediction.
M-values can be plotted with p-values in a two-dimensional space, called PM-plot, which has the following interpretations.
GxE Interpretation
Joint analysis of multiple studies with varying environmental conditions using a meta-analysis can provide unique opportunity to identify gene-by-environment interactions. Examining both forest plot and PM-plot allows us to easily hypothesize that there is a specific group of studies showing gene-by-environment interactions. For example, let's consider study 10-11 containing mouse C57BL/6 x DBA/2 F2 strains with homozygous deficiency in leptin receptor (db/db). In forest plot, effect size estimate from male study is much larger than that of female study, but standard error of the female effect size estimates is large so that it is not clear that the effect size of female study is zero. However the m-value prediction clearly shows the distinction between male and female studies, which suggest gene-by-sex interaction under the homozygous deficiency in leptin receptor (db/db) condition.
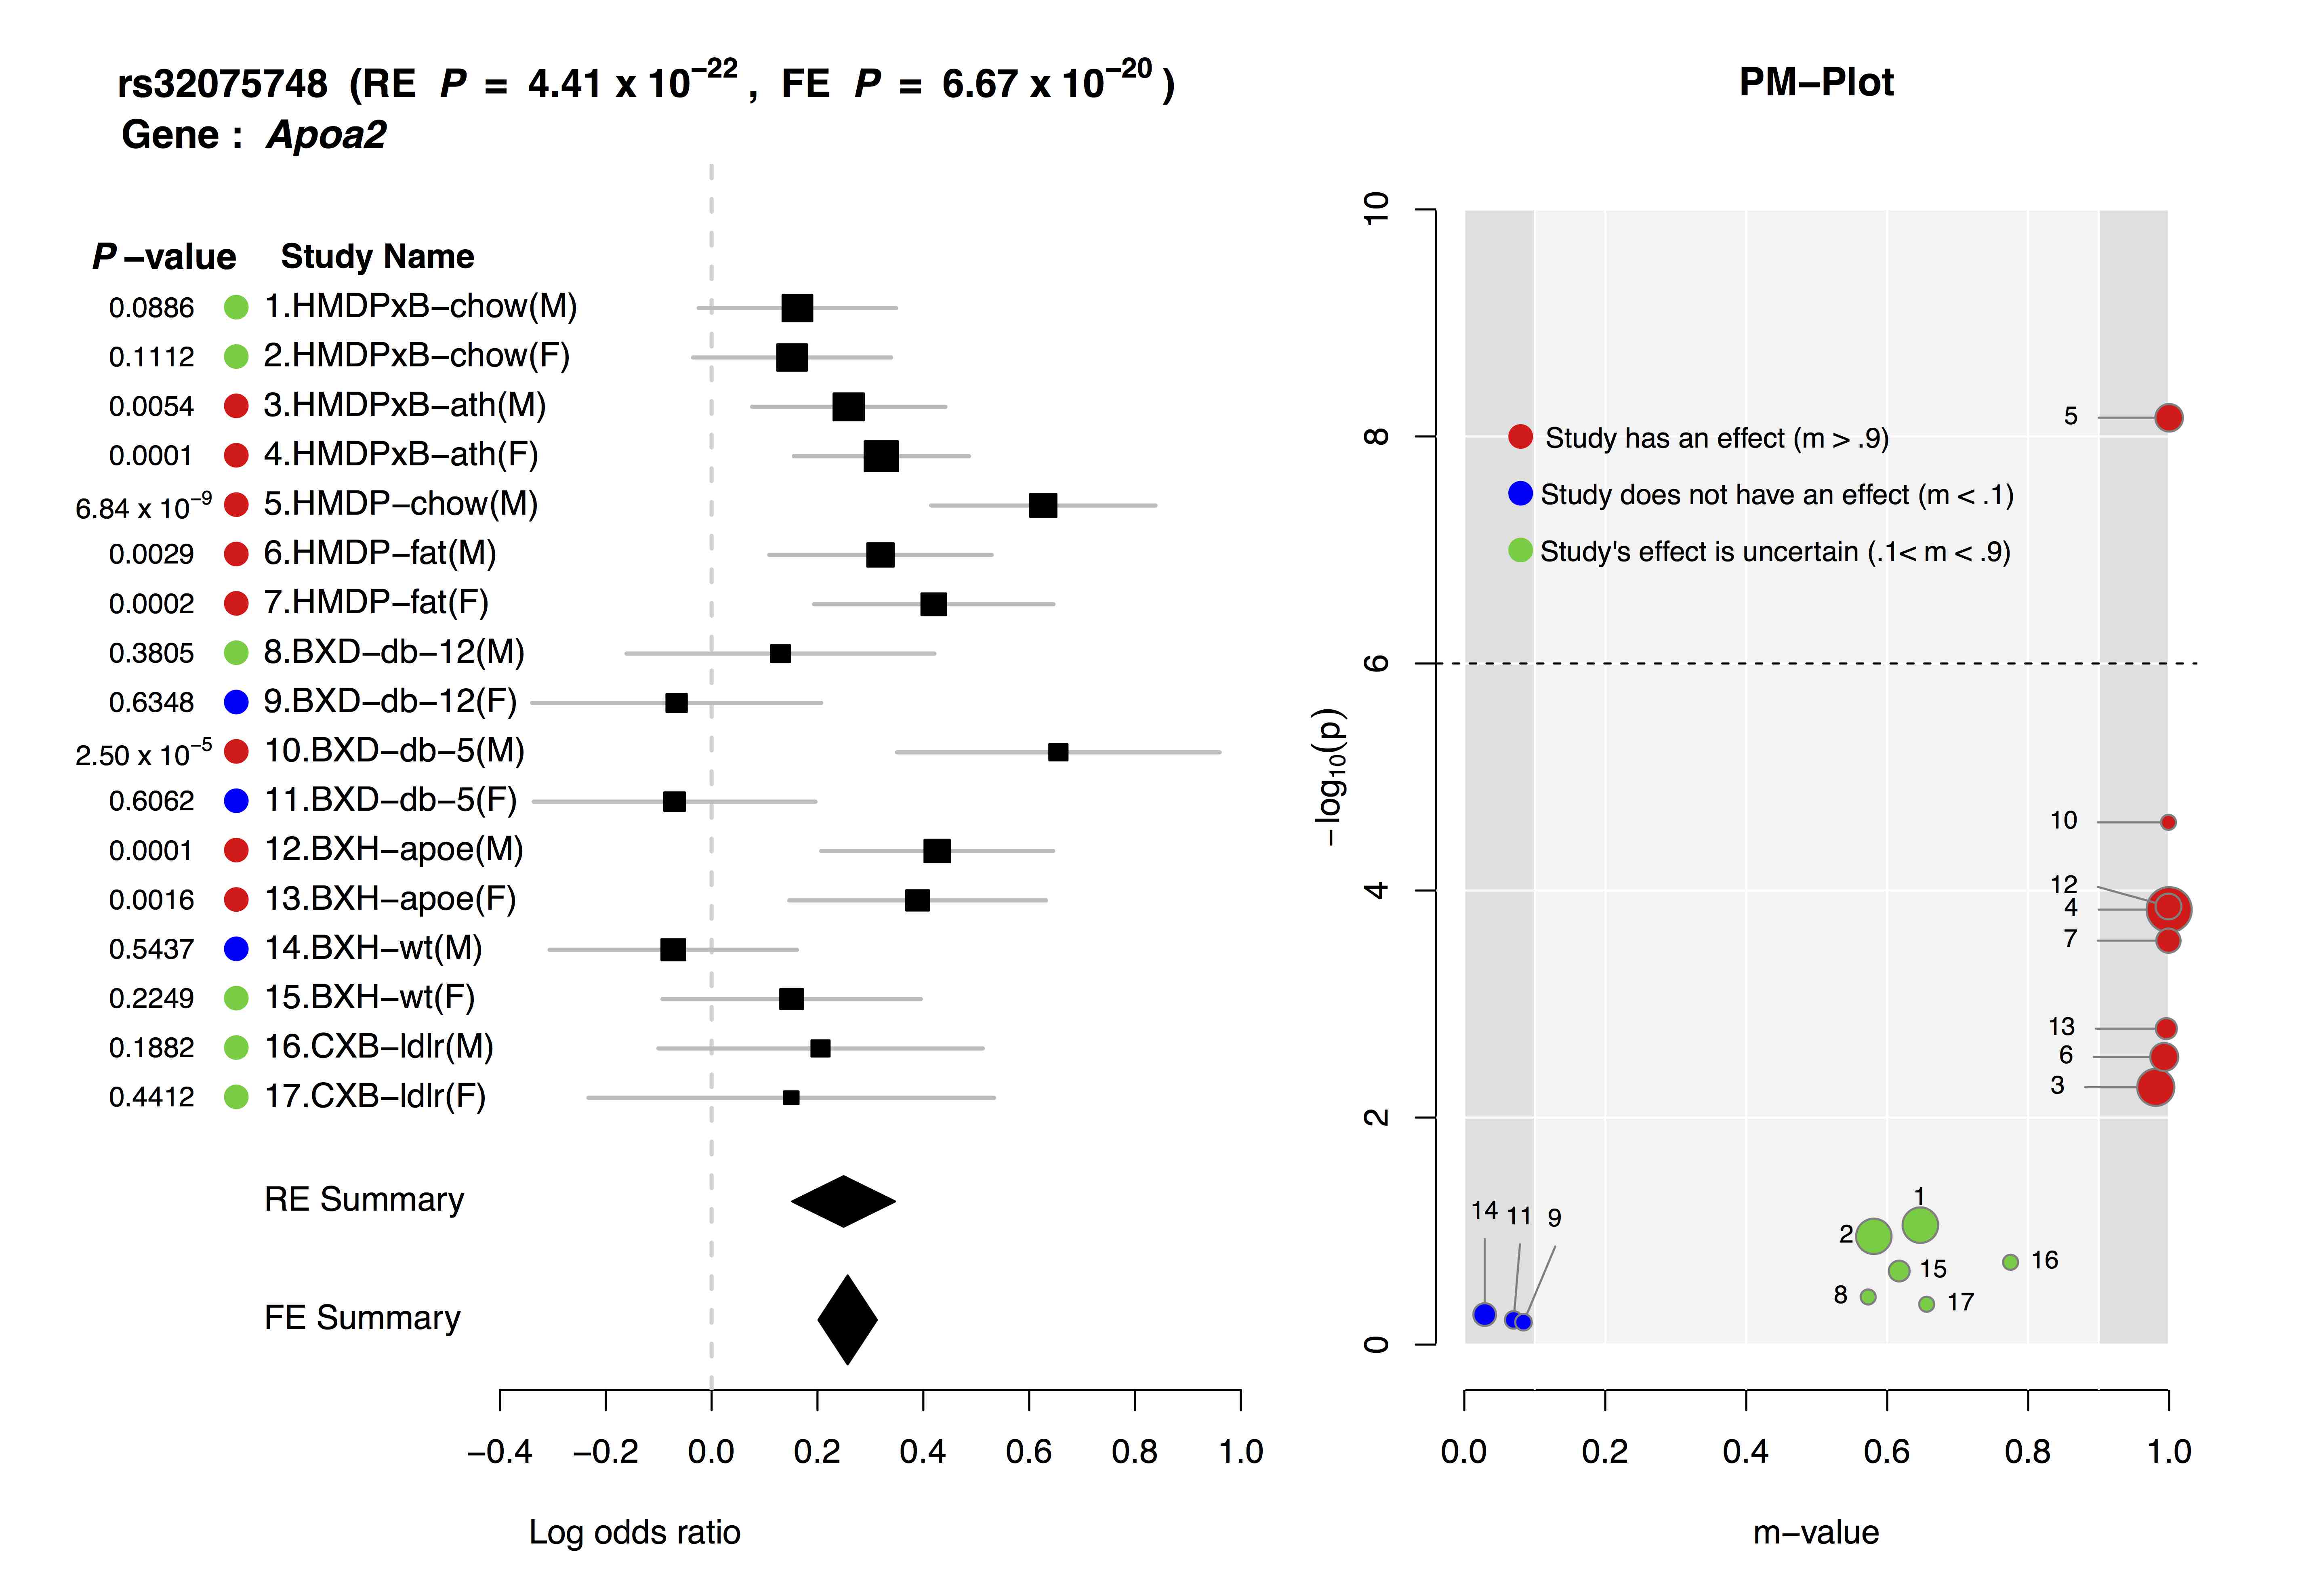
The above is an example ForestPMPlot of 17 HDL mouse studies from the paper of Kang et al.