METASOFT
METASOFT is a free, open-source meta-analysis software tool for genome-wide association study analysis, designed to perform a range of basic and advanced meta-analytic methods in an efficient manner.
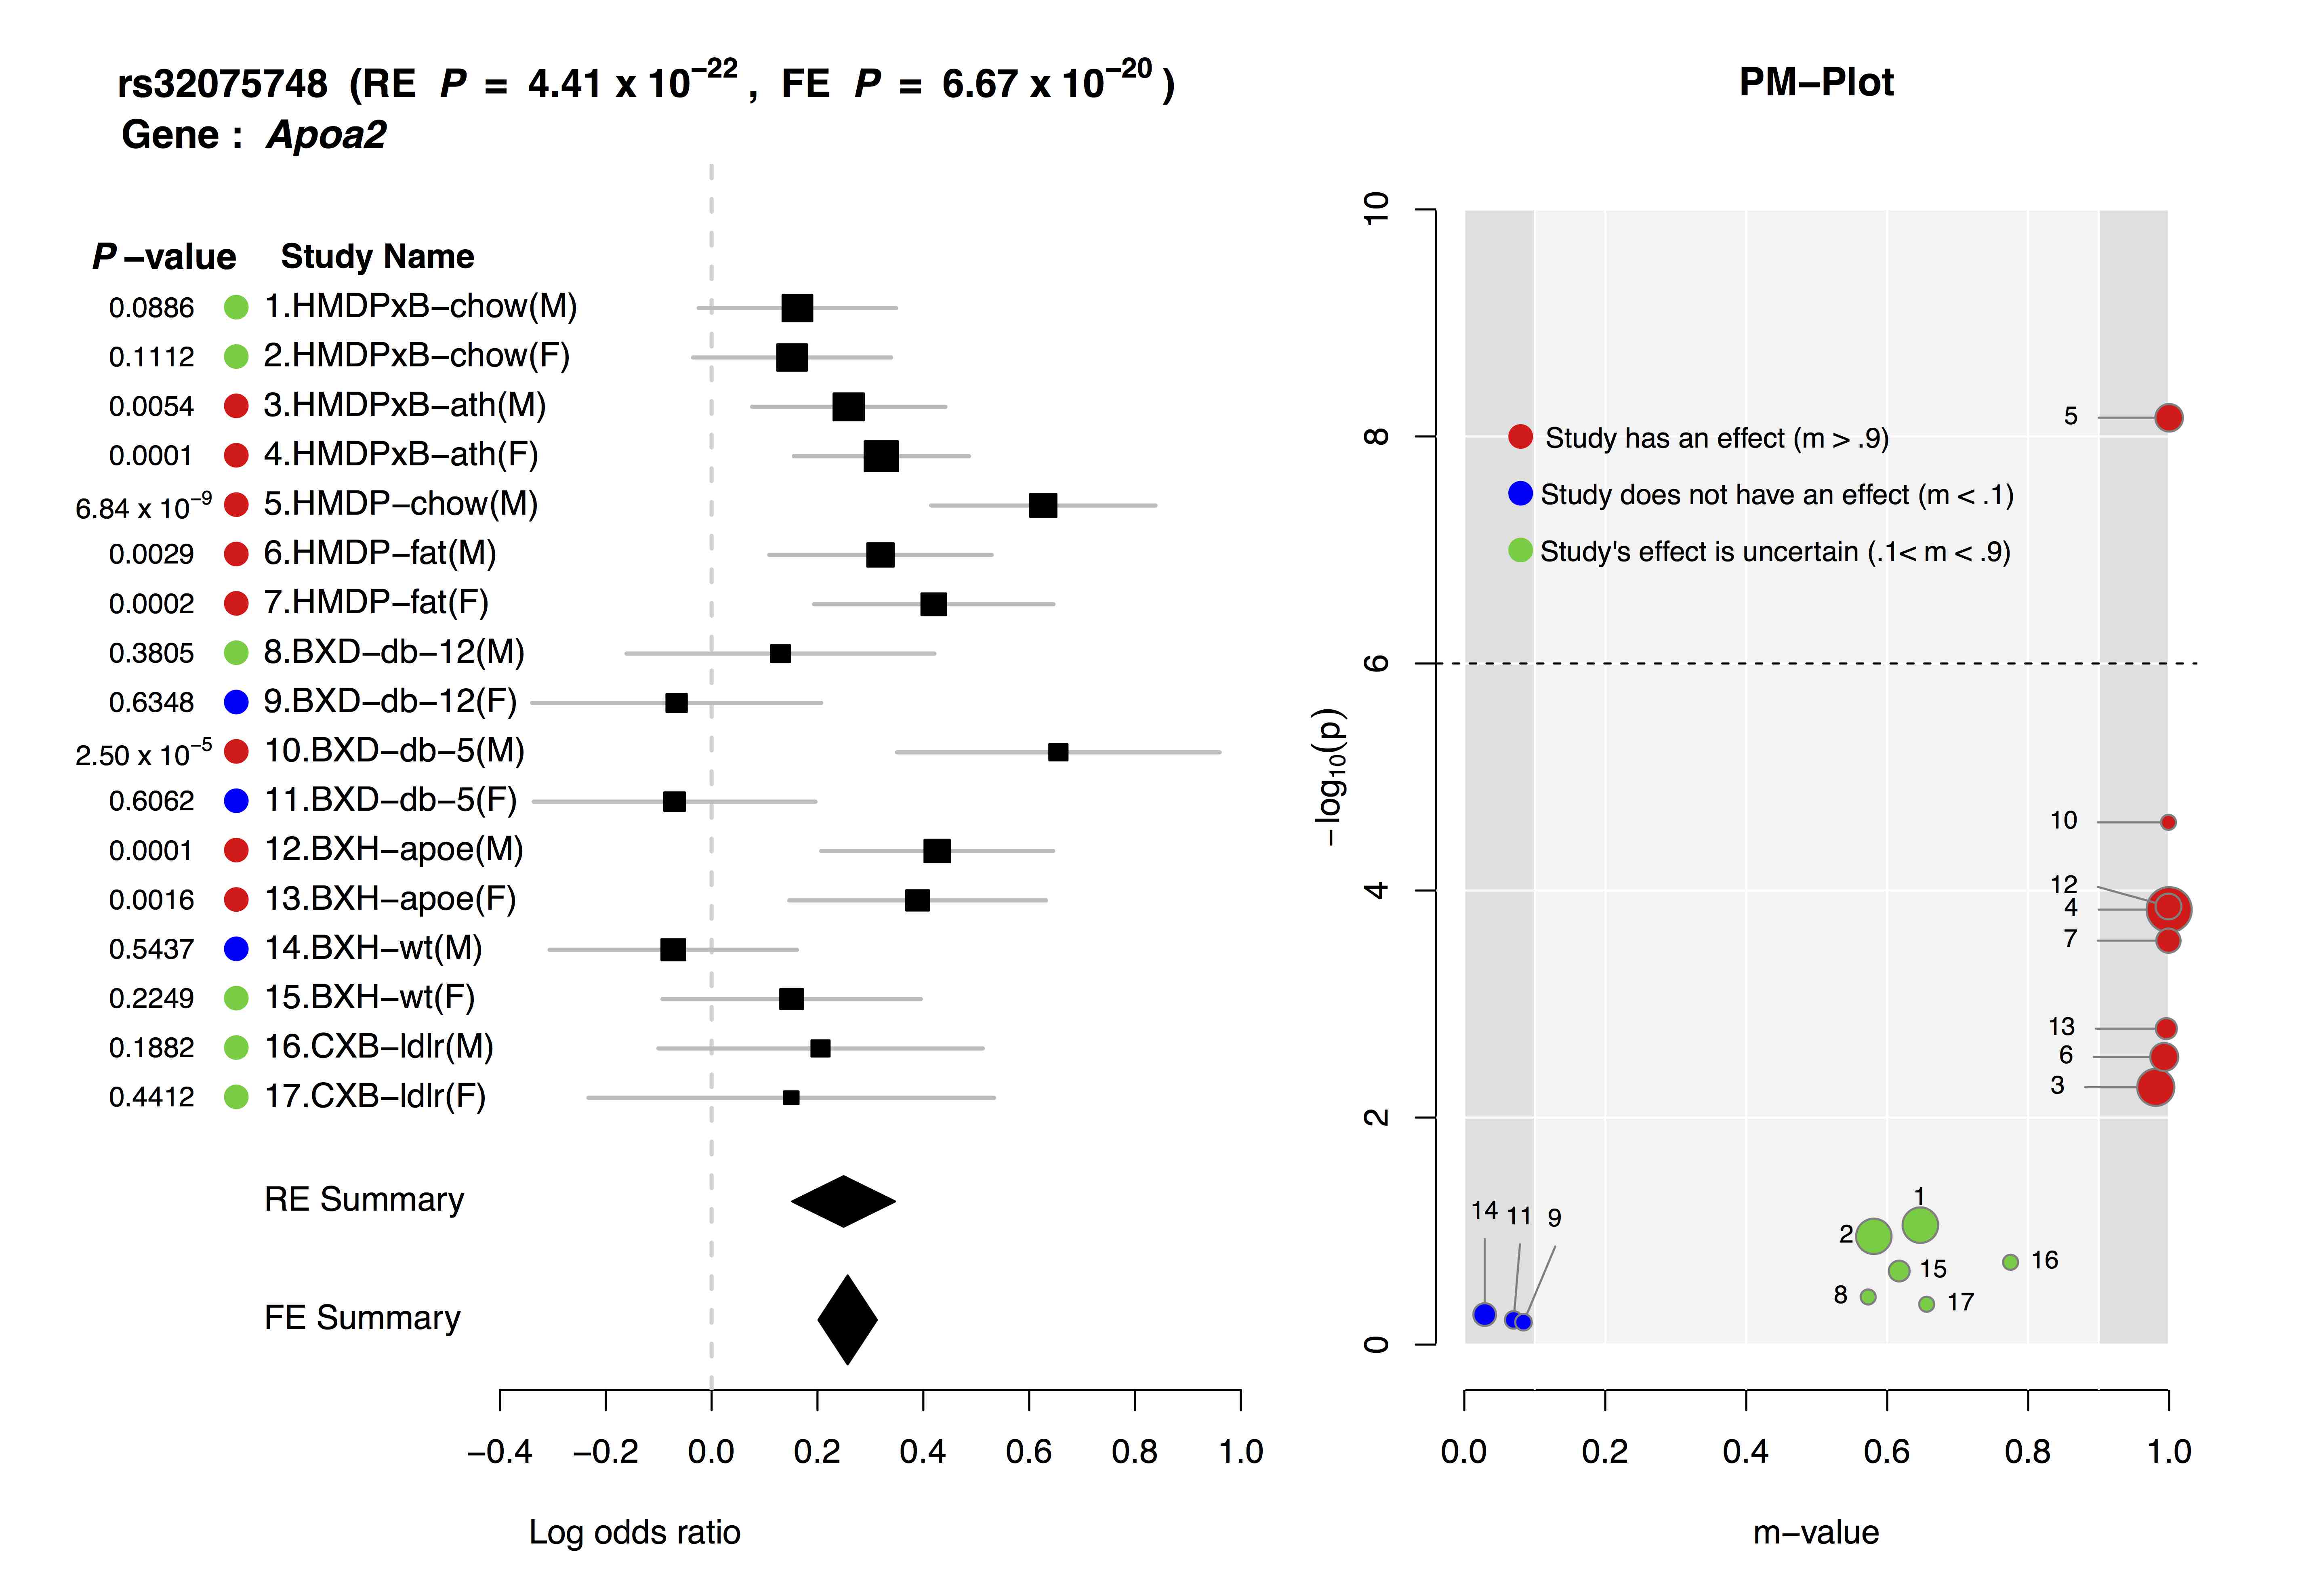
ForestPMPlot is a free, open-source a python-interfaced R package tool for analyzing the heterogeneous studies in meta-analysis by visualizing the effect size differences between studies. The resulting plot can facilitate the better understanding of heterogeneous genetic effects on the phenotype in different study conditions.
Overview
METASOFT provides the following methods:- Fixed Effects model (FE)
- Fixed effects model based on inverse-variance-weighted effect size.
- Random Effects model (RE)
- Conventional random effects model based on inverse-variance-weighted effect size (very conservative).
- Han and Eskin's Random Effects model (RE2)
- New random effects model optimized to detect associations under heterogeneity. (Han and Eskin, AJHG 2011)
- Binary Effects model (BE)
- New random effects model optimized to detect associations when some studies have an effect and some studies do not. (Han and Eskin, PLoS Genetics 2012)
- Forest Plot
- For each study, it displays p-value, study name, log odds ratio and its standard error and summary statistic.
- m-value
-
m-value is the posterior probability that the effect exists in each study. m-values have the following interpretations.
Small m-value (e.g. < 0.1): The study is predicted to not have an effect.
Large m-value (e.g. > 0.9): The study is predicted to have an effect.
Otherwise: It is ambiguous to make a prediction.
- PM Plot
- PM-Plot visualizes the m-value of each study along with its p-value. The X-axis of the PM-Plot represents the m-value between 0 and 1 and the Y-axis represents the statistical significance, −log10(p-value). PM-Plot allows us to predict which study have an effect and which study does not have an effect. The dot size represents the study sample size.

Download
Metasoft.zip containing the following:
Metasoft.jar (java archive package file)
HanEskinPvalueTable.txt (tabulated p-value file required to perform RE2)
example.txt (Example meta-analysis data consisting of 3 studies)
README
LICENSE
plink2metasoft.py (PLINK format converter; PLINK .assoc files → METASOFT format)
plink2metasoft_subroutine.R (a subroutine file used by format converter)
Optional Java source code files (only if you need)
ForestPMPlot.zip containing the following:
pmplot.py (main python script)
forestpmplot.R (R ploting engine)
data/input.txt (a sample MetaSoft input file )
data/output.txt (a sample MetaSoft output file )
study.name.txt (a sample file containing a list of study names)
study.order.txt (a sample file containing a list of display indices)
run.sh (a sample running script for generating Apoa2.pdf)
Apoa2.pdf (a sample resulting ForestPMPlot)
README
LICENSE
You can SUBSCRIBE to our mailing list to be notified for any major updates and bug fixes.
Version/bug info
METASOFT
v2.0.1 (2012-08-21) PLINK format converter is added.
v2.0.0 (2012-02-15) M-values are computed using exact calculation. User interface has been changed.
v1.0.0 (2011-08-25) First major release. Bug fix.
v0.3.1 (2011-07-07) Bug fix.
v0.3.0 (2011-07-06) Bug fix. Binary effects model and M-values implemented.
v0.2.2 (2011-05-19) Bug fix.
v0.2.1 (2011-05-16) Small changes in output format.
v0.2.0 (2011-05-10) Bug fix. Genomic control method implemented.
v0.1.0 (2011-04-18) Initial prototype version deployed
ForestPMPlot
v1.0.1 (2014-10-24) Bug fix.
v1.0.0 (2014-08-12) First major release.
Publication
If you use our software or refer to the new random effects model method, please cite
Buhm Han and Eleazar Eskin, “Random-Effects Model Aimed at Discovering Associations in Meta-Analysis of Genome-wide Association Studies”, The American Journal of Human Genetics (2011) 88, 586-598. LINK
If you use m-values or the binary effects model method, please cite
Buhm Han and Eleazar Eskin, “Interpreting Meta-Analysis of Genome-wide Association Studies”, In Press. PLoS Genetics (2012). (Manuscript available here)
If you want to refer the GxE interpretation, please cite
Eun Yong Kang and Buhm Han and Nicholas Furlotte and Jong Wha J. Joo and Diana Shih and Richard C. Davis and Aldons J. Lusis and Eleazar Eskin, “ Meta-Analysis Identifies Gene-by-Environment Interactions as Demonstrated in a Study of 4,965 Mice ”, PLOS Genetics (2014) 10(1), e1004022. LINK
If you use our software to plot ForestPMPlot, please cite
Eun Yong Kang and Buhm Han and Eleazar Eskin, “ ForestPMplot: a flexible tool for visualizing heterogeneity between studies in meta analysis”, Submitted
If you refer multiple tissue eQTL method, please cite
Contact
METASOFT
Buhm Han : buhan (AT) cs.ucla.edu , http:www.cs.ucla.du/~buhan
ForestPMPlot
Eun Yong Kang : ekang (AT) cs.ucla.edu
Funding information
B.H. and E.E. are supported by National Science Foundation grants 0513612, 0731455, 0729049 and 0916676, and NIH grants K25-HL080079 and U01-DA024417. B.H. is supported by the Samsung Scholarship. This research was supported in part by the University of California, Los Angeles subcontract of contract N01-ES-45530 from the National Toxicology Program and National Institute of Environmental Health Sciences to Perlegen Sciences.